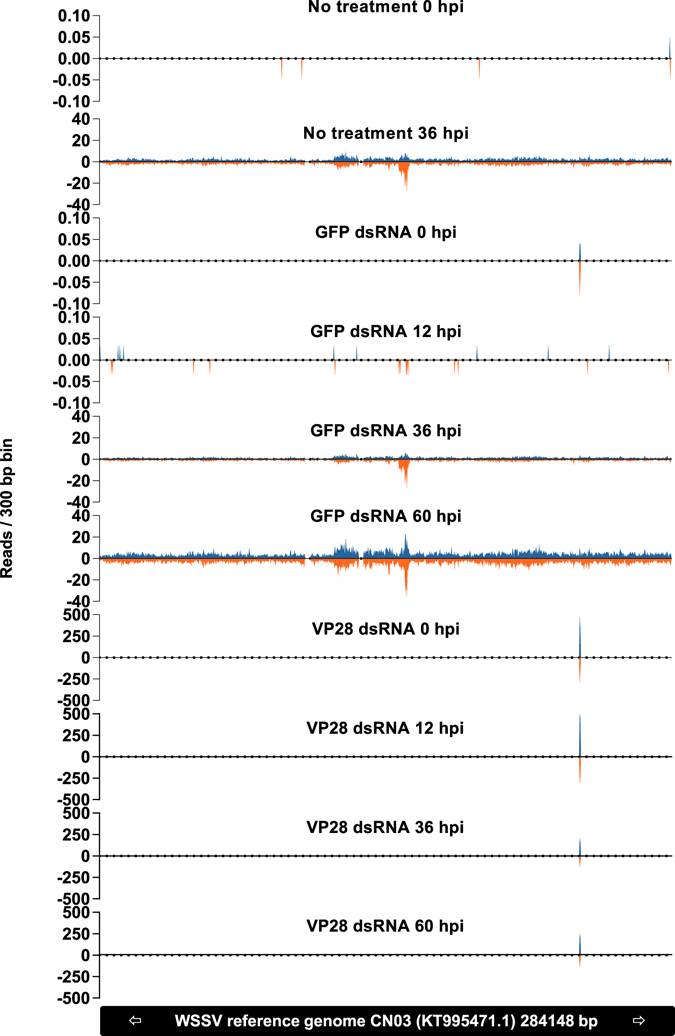
Figure 11.

The frequency of 22 nt siRNAs per 300 bp bin across a reference WSSV genome is shown to emphasize the difference between a natural RNAi response to WSSV infection in comparison to a VP28 dsRNA induced siRNA response. RNA was isolated from stomach tissue and equal amounts were pooled for each sample within a given group at a given time point. RNA sequencing was performed on these pools and 22 nt long siRNAs were filtered out to be analyzed separately. The Y-axis represents reads per million total reads for a given sample (RPM), and positive and negative values indicates forward- and reverse mapping siRNAs respectively.
