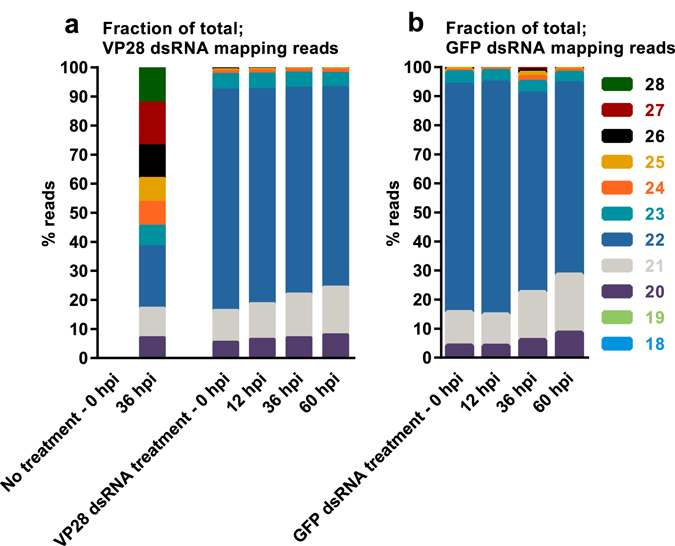
Figure 9.

Small RNA length distribution given as fractions of total. RNA was isolated from stomach tissue and equal amounts were pooled for each sample within a given group at a given time point. RNA sequencing was performed on these pools and obtained data was subjected to an analysis of read length distribution frequency. Here, relative distribution of read lengths obtained from reads mapping to the VP28 (a) and GFP (b) dsRNA treatment sequence are shown to emphasize the dominance of 22 nt reads in samples were the only source of such sequences are the injected dsRNA.
