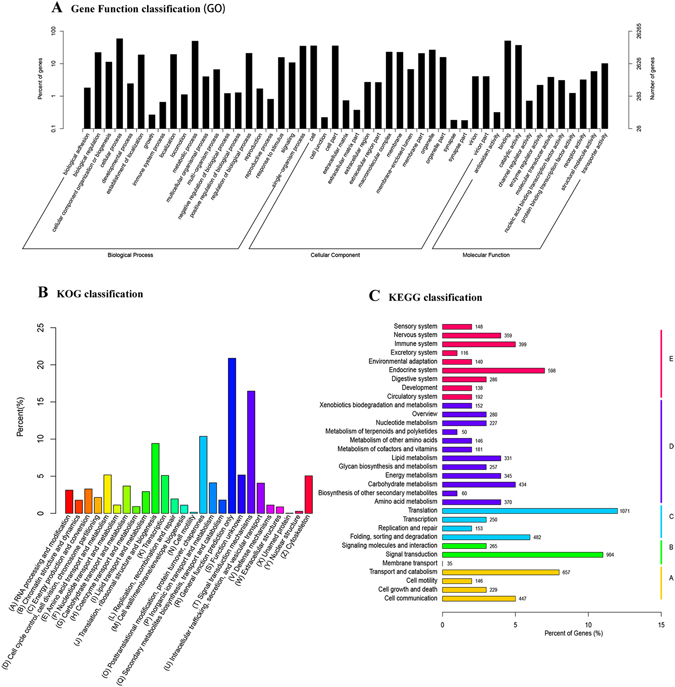
Figure 2.

Gene ontology (GO), Clusters of Orthologous Group (COG) and Kyoto Encyclopedia of Genes and Genomes (KEGG) classification of all unigenes. (A) The GO classification results summarized in three main GO categories (cellular component, molecular function, and biological process). The x-axis represents the GO ontology. The left y-axis indicates the percentage of unigenes. The right y-axis indicates the number of unigenes. (B) COG classification of all unigenes. The columns represent the number of unigenes in each subcategory. (C) KEGG classification of all unigenes. The columns represent the number of unigenes in each subcategory.
