Figure 8.

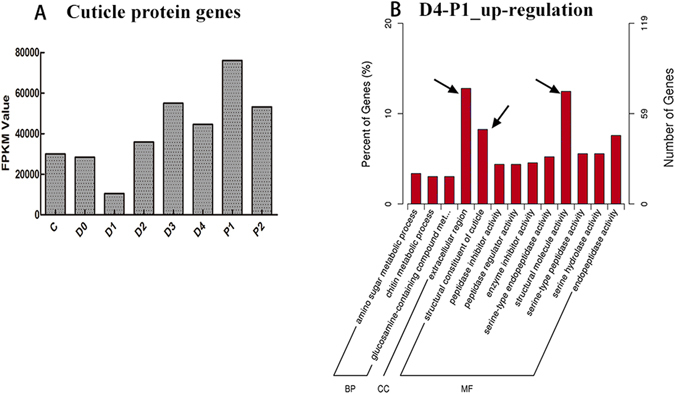
Expression profiles of cuticle proteins and GO enrichment of up-regulated differentially expressed genes (DEGs) in D4-P1. (A) Expression profiles of cuticle protein genes. Row axis represents the developmental stages. Columns represent the total FPKM value of genes. (B) The GO terms of up-regulated DEGs in D4-P1. The arrows indicate the terms related to exoskeleton. Extracellular region (GO:0005576) with 76 DEGs are dominant in all categories. Structural molecule activity (GO:0005198) and Structural constituent of cuticle (GO:0042302) consisted of 74 and 49 DEGs that were dominant in categories of molecular function. The x-axis represents the name of GO subcategories. The left y-axis indicates the percent of genes. The right y-axis indicates the number of DEGs expressed in a given sub-category. The English in this document has been checked by native English-language editors. And the logical presentation of ideas and the structure of the paper were also checked during the editing process. The edit was performed by professional editors at American Journal Experts (www.aje.com), which is recommended by editorial staffs of Scientific Reports.
