
Figure 4.
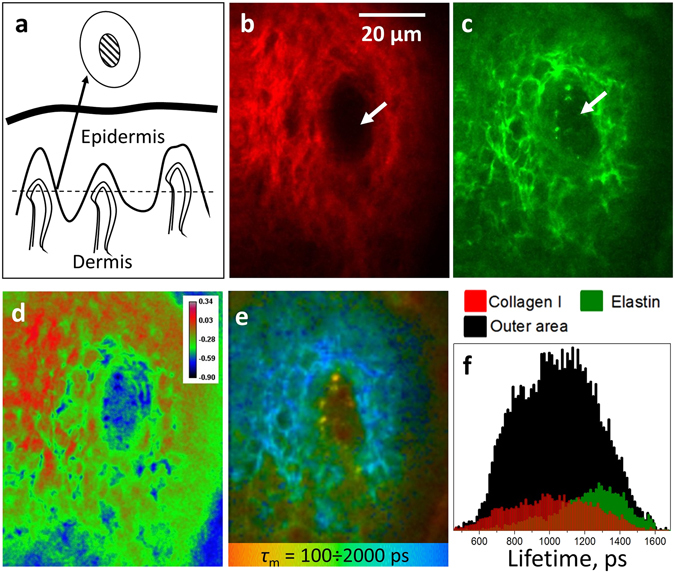
(a) Schematic representation of the skin structure. The dashed line corresponds to the plane of the papillary dermis cross-section measured with MPT, the outer and inner circles correspond to the cross-section of dermal papilla and the inner area around capillary. (b,c) Two-photon images of the dermal papilla: SHG and TPAEF signals, respectively. The white arrows correspond to the “hollow” area inside the papilla. (d) Spatial distribution of the SAAID index (SAAID = (SHG – TPEAF)/(SHG + TPEAF)) in the dermal papilla. (e) FLIM image of the dermal papilla, pixel colors correspond to different values of the mean fluorescence lifetime τ m in the 100 ÷ 2000 ps range. (f) Mean lifetime distributions obtained for the outer area, positive SAAID (>0.15, collagen I) and negative SAAID (−0.4 ÷ −0.35) regions of the dermal papilla (see text for details).