
Figure 5.
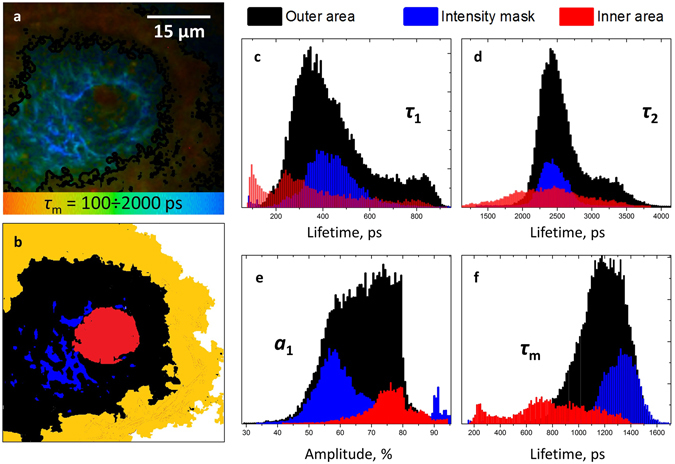
(a) FLIM image of the papillary structure, colors correspond to the values of mean fluorescence lifetime in the 100 ÷ 2000 ps range. (b) segmentation of the FLIM image of papilla into the inner area (red), outer area (black) and intensity mask area (blue). The yellow area corresponds to the melanin-rich area around the papilla. (c–f) – distributions of fast (τ 1) and slow (τ 2) decay components, amplitude of the fast component a 1 and mean fluorescence lifetime, respectively.