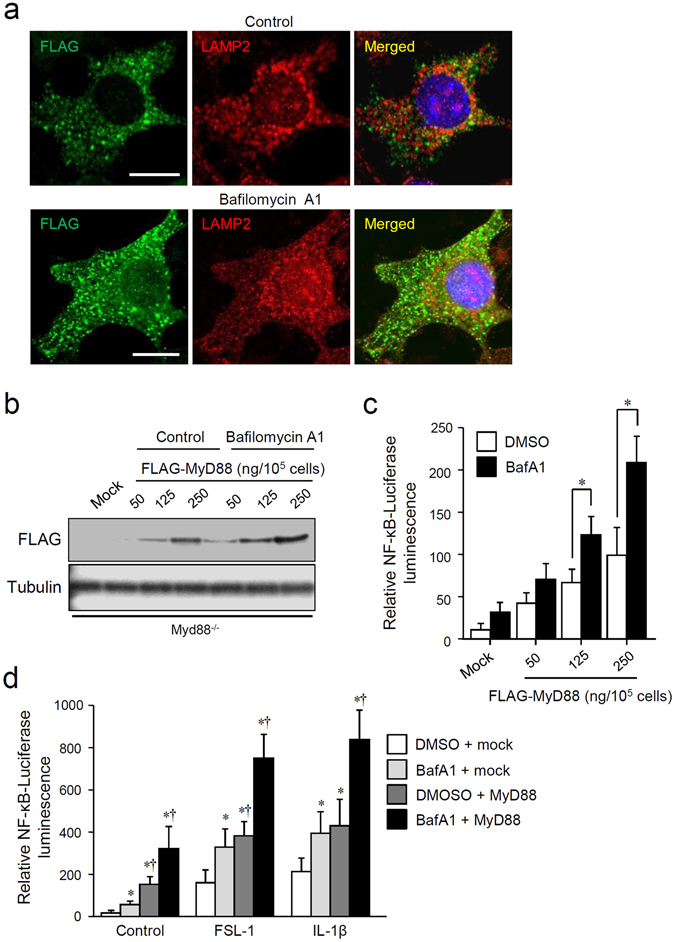
Figure 3.

Lysosomal inhibition enhances activation of MyD88-dependent inflammatory signals via accumulation of MyD88. (a) BafA1 treatment increases expression of overexpressed MyD88. RAW264.7 cells were transfected with a plasmid encoding FLAG epitope-tagged MyD88, and then incubated with 0.5% DMSO (control) or 100 nM BafA1 for 12 h. The cells were fixed, and immunofluorescent staining for FLAG (green) and LAMP2 (red) was carried out. Cell nuclei were stained with Hoechst 33342. Images were captured by means of a confocal microscope. Scale bar: 10 μm. (b) BafA1 treatment increases the expression levels of overexpressed MyD88. RAW264.7 cells were transfected with the indicated amounts of a plasmid encoding FLAG epitope-tagged MyD88 or 250 ng/105 cells of an empty pcDNA3 plasmid (mock), and then incubated with or without 100 nM BafA1 for 12 h. Expression levels of FLAG-MyD88 and α-tubulin were assessed by immunoblotting. All the blots were obtained under the same experimental conditions, and the cropped images of the blots are shown. The uncropped images are in Supplementary Fig. 19. (c) BafA1 treatment enhances overexpressed MyD88-induced NF-κB-dependent transcriptional activity. An NF-κB-driven luciferase reporter assay was performed on RAW264.7 cells transfected with a plasmid encoding FLAG epitope-tagged MyD88 or with 250 ng/105 cells of an empty pcDNA3 plasmid (mock). The cells were incubated with 100 nM BafA1 for 12 h. Relative NF-κB activity was measured, and the data are expressed as mean ± SD (n = 3); *p < 0.05 (DMSO versus BafA1), one-way ANOVA and Dunnett’s test for post-hoc comparisons (μc < μi). (d) TLR2- or IL-1R-activated NF-κB-dependent transcriptional activity is augmented by accumulated MyD88. An NF-κB-driven luciferase reporter assay was performed on RAW264.7 cells transfected with 250 ng/105 cells of a plasmid encoding FLAG epitope-tagged MyD88 (MyD88) or with an empty plasmid (mock). The cells were incubated with 0.5% DMSO or 100 nM BafA1 for 12 h, followed by incubation with or without 100 nM FSL-1 or 10 ng/ml IL-1β. Relative NF-κB activity was measured, and the data are expressed as mean ± SD (n = 3); *p < 0.05 (versus DMSO), Student’s t test, † p < 0.05 (versus DMSO), one-way ANOVA and Dunnett’s test for post-hoc comparisons (μc < μi).
