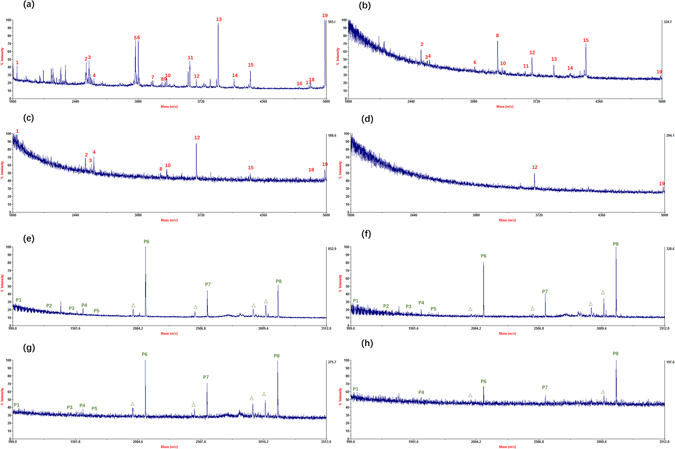
Figure 3.

MALDI-TOF mass spectra for the glycopeptide enrichment from HRP tryptic digest: (a) 25 fmol/μL, (b) 5 fmol/μL, (c) 1 fmol/μL, and (d) 0.2 fmol/μL; for the phosphopeptide enrichment from β-Casein tryptic digest: (e) 25 fmol/μL, (f) 1 fmol/μL, (g) 0.2 fmol/μL, and (h) 0.02 fmol/μL, where glycopeptides were marked with Arabic Numerals in red, phosphopeptides were marked with Arabic Numerals in green, and Δ indicates the losses of phosphoric acid.
