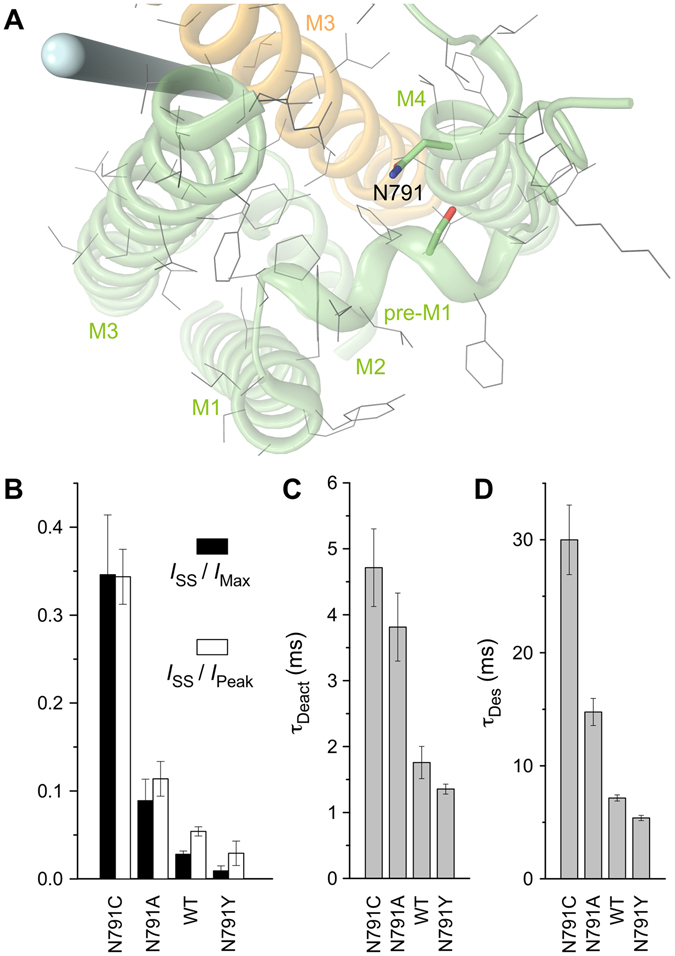
Figure 3.

Substitutions of asparagine N791. (A) Close-up view of the region encompassing noncompetitive inhibitor binding site, with N791 shown as thick (green, blue and red) and other residues thin (grey) sticks. The pore axis is illustrated by a blue cylinder. (B–D) The average values of fractions of non-desensitized channels, I SS/I Max and I SS/I Peak (B) and time constants of deactivation, τ Deact (C) and desensitization, τ Des (D) for wild type GluA2 and mutant receptors. Error bars represent SEMs.
