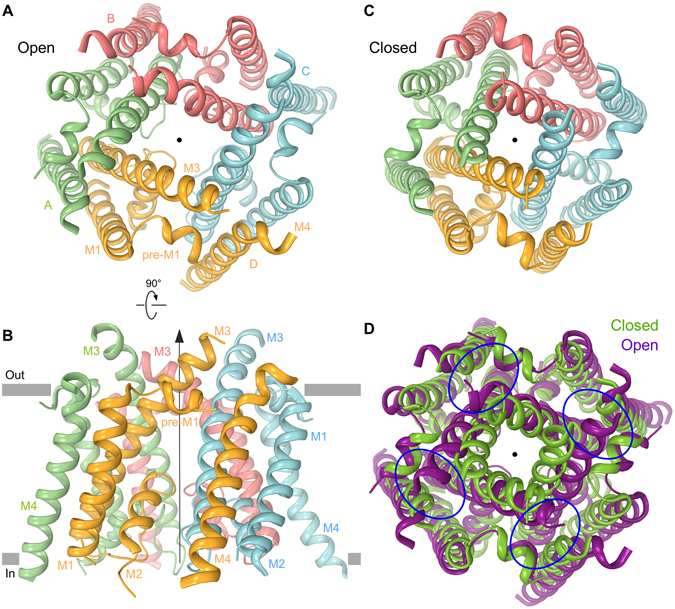
Figure 5.

MD simulated ion channel open state. (A,B) MD simulated structure of GluA2 ion channel in the open state (see Methods and text) viewed extracellularly (A) or parallel to the membrane (B). The pore axis is illustrated by a black arrow. (C) Closed channel from GluA2apo structure (PDB ID: 5L1B) viewed extracellularly. (D) Superposition of the ion channel open (purple) and closed (green) conformations from (A and B) respectively. Blue ovals designate the noncompetitive inhibitor binding pockets.
