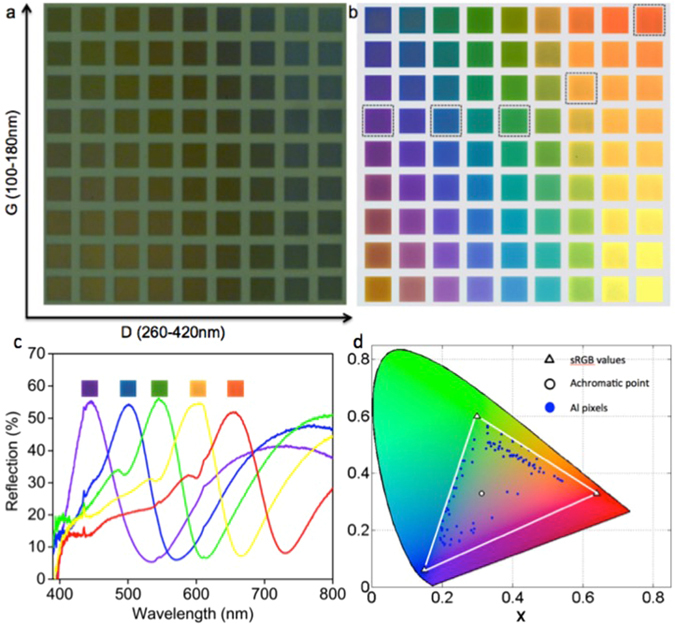
Figure 2.

Optical micro-images and spectral analyses of the colour pallets with varying square size D and gap size G. Each pallet of 20 μm square consists of 2D arrays of sub-micron structures arranged in a square lattice. The size of the Al square patch D varies from 260 nm to 420 nm with an increment of 20 nm in the horizontal axis and the gap size G varies from 100 nm to 180 nm with an increment of 10 nm in the vertical axis. (a) PMMA nano pillars arranged in the square lattice show no colouration before metal deposition. (b) After the deposition of thin Al layer of uniform thickness, the pallets displayed bright and distinct colours depending on the geometrical parameters D, G and P. (c) Experimental reflection spectra of selected pallets (highlighted within the black boxes in (b)) captured using micro-spectroscopic technique. (d) Corresponding positions of all colours in (b) plotted in the CIE1931 colour space. The blue circles represent the tristimulus values of the aluminum colour pixels, which are scattered far from the achromatic point represented by the white circle. The blue circles formed a ring around the achromatic point confirming the capability of the proposed plasmonic geometry for the generation of full colours with high colour saturation. The x and y values for the primary colours red, green and blue are 0.5421; 0.3738, 0.3290; 0.5679 and 0.1951; 0.1722 respectively and are comparable with that of the sRGB values 0.6400; 0.3300, 0.3000; 0.6000 and 0.1500; 0.0600 common to all displays, represented by the white triangles in the figure.
