Figure 3.

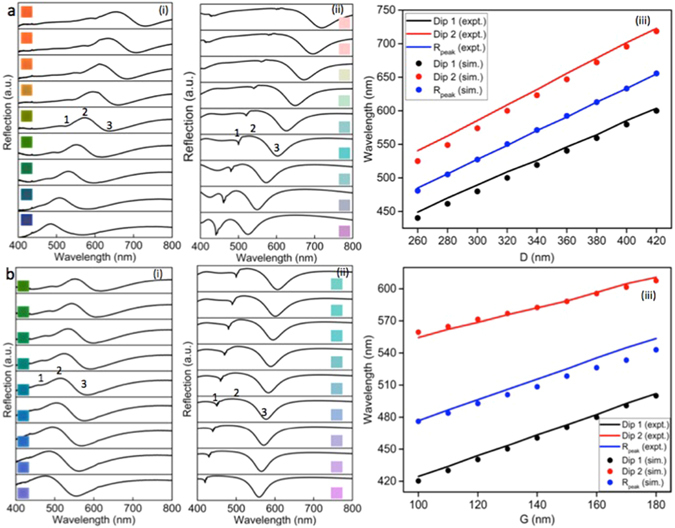
Spectral analyses of the colour pallets using micro-spectroscopic technique and a comparison between measured and simulated spectra. (a) Spectral analyses of selected colour pallets with varying D and fixed G, (i) experimental spectra of the colour pallets (inset shows the corresponding colours) with a fixed gap size G of 180 nm and a varying square size D from 260 nm to 420 nm, (ii) corresponding simulated spectra using FDTD algorithm with the inset shows predicted colours from the simulated spectra for each colour pallet and (iii) experimentally (lines) observed resonance dip and peak shifts as a function of D and its comparison with the simulated (dots) values. (b) Spectral analyses of selected colour pallets with varying G and fixed D, (i) experimental spectra of the colour pallets (inset shows the corresponding colours) with a fixed square size D of 320 nm and a varying gap size G from 100 nm to 180 nm, (ii) corresponding simulated spectra using FDTD algorithm with the inset shows predicted colours from the simulated spectra for each colour pallet and (iii) experimentally (lines) observed resonance dip and peak shifts as a function of G and its comparison with the simulated (dots) values. Positions marked as 1, 2 and 3 in all figures represent Dip1, Rpeak, and Dip2, respectively.
