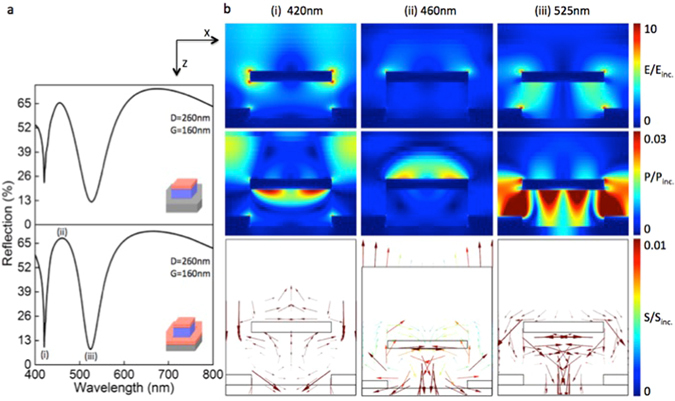
Figure 5.

Numerical analyses of the spectral and electromagnetic behavior of the plasmonic structures using FDTD algorithm. (a) Calculated reflectance for the structures with (bottom) and without (top) back reflector, confirms the presence of multiple plasmonic resonances in both the cases. It is clear from the bottom figure that the strength of plasmonic light absorption increases with the presence of back reflector for both the resonances at (i) and (iii). (b) Electric field enhancement plots (top), time averaged power flow plots (middle) and Poynting vector plots (bottom) for the structure D = 260 nm with G = 160 nm at spectral positions marked in (a). (i) Dip 1 corresponds to the plasmonic resonance at 420 nm and it enhances the light absorption in to the substrate through the polymer nano pillar. (ii) Enhanced electric field due to the strongly radiating dipole resonance at 460 nm scatter coherently to form the strong reflective peak Rpeak. (iii) The Dip 2 corresponds to a strong LSPR at 525 nm enhances the electric field around the nano hole which in turn facilitates increased light absorption in to the substrate. In all simulations normal incidence of plane wave was carried out with the electric field polarized in the x-axis and the k-vector in the z-axis pointing from above.
