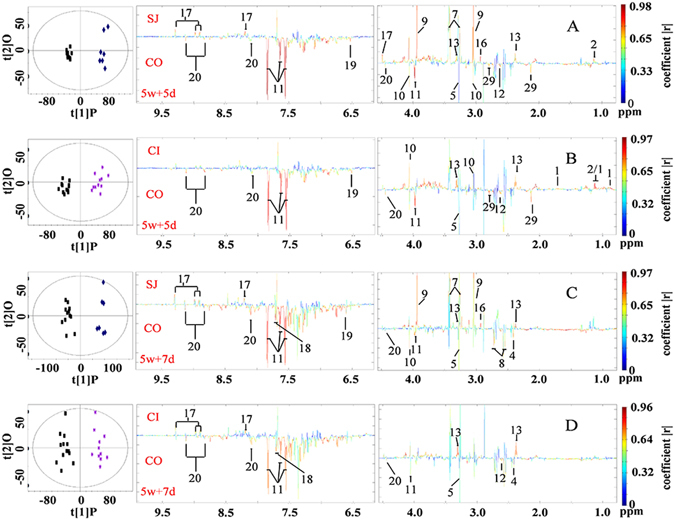
Figure 3.

Scores plots and corresponding color-coded coefficient plots. These plots derived from O-PLS-DA of 1H NMR spectral data obtained from urine of uninfected control mice (CO), S. japonicum infected mice (SJ) and mice coinfected with S. japonicum and S. typhimurium (CI). Signals upwards indicate increase in the levels of metabolites compared with the control; signals downwards denote a decrease. 5w + 5d, time point, five days after coinfection; 5w + 7d, time point, seven days after coinfection. Keys: 1, 2-keto-3-methy-valerate; 2, 2-keto-isovalerate; 4, succinate; 5, trimethylamine-N-oxide (TMAO); 7, taurine; 8, citrate; 9, creatine; 10, creatinine; 11, hippurate; 12, 2-keto-isocaproate; 13, 3-ureidopropionate (3-UP); 16, dimethylglycine (DMG); 17, N-methylnicotinamide; 18, indoxyl sulfate; 19, fumarate; 20, trigonelline; 29, N-acetylglutamic acid.
