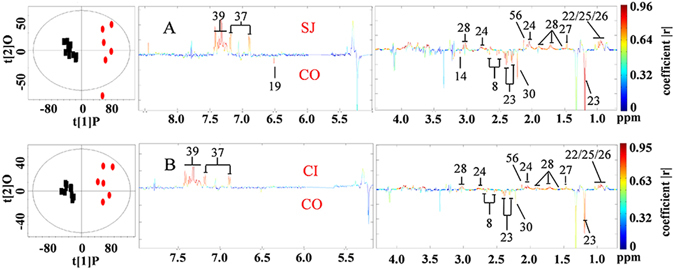
Figure 5.

Scores plots and corresponding color-coded coefficient plots. These plots derived from O-PLS-DA of 1H NMR spectra obtained from serum of uninfected control mice (CO), S. japonicum infected mice (SJ), S. japonicum and S. typhimurium coinfected mice (CI). Signals upwards, increase compared with the control; signals downwards, decrease compared with the control. Keys: 8, citrate; 14, malonate; 19, fumarate; 22, valine; 23, 3-hydroxybutyrate; 24, lipids; 25, isoleucine; 26, leucine; 27, alanine; 28, lysine; 30, acetone; 37, tyrosine; 39, phenylalanine; 56, O-acetylglycoproteins.
