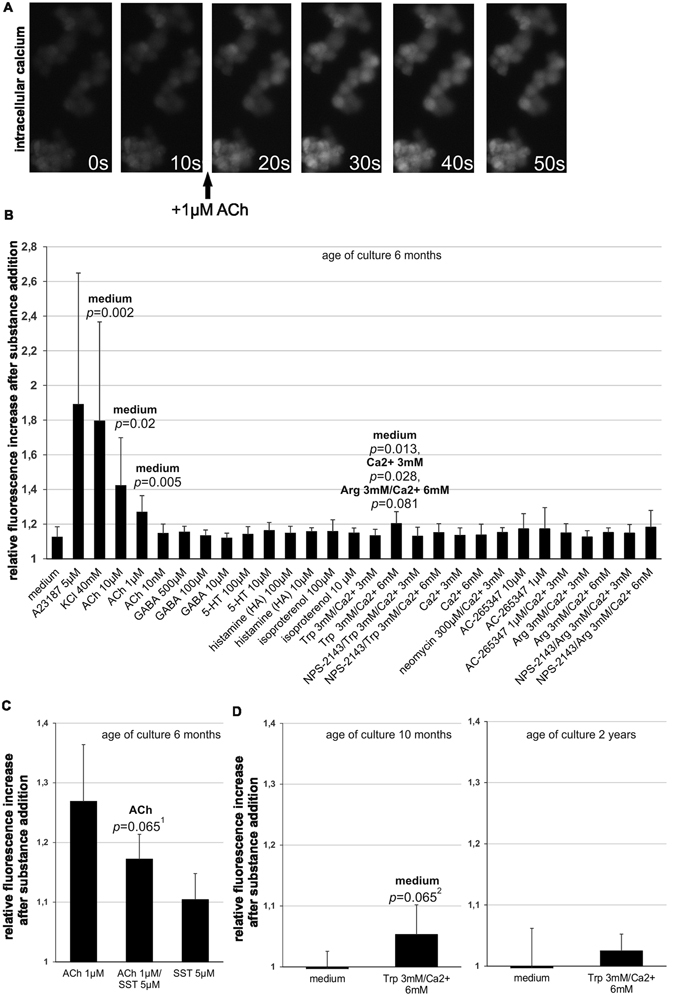
Figure 2.

Intracellular [Ca2+]i response of P-STS to addition of neurotransmitters and CaSR ligands. (A) Time course of intracellular fluorescence of a group of Fluo-4 AM-stained P-STS cells after treatment with 1 µM ACh. (B) Screening experiment (see explanation in Methods) for fluorescence enhancement measured 10 s after the start of substance addition in relation to baseline fluorescence. Final substance concentrations are indicated. NPS-2143 (final concentration 2 µM) was added 1 min before taking the first time point for baseline determination. Mean values and standard deviations were calculated from 3–15 independent samples. Statistical significance compared to the treatment group indicated on top of the bar was calculated by univariate analysis with the Mann-Whitney U-test. (C) Inhibition of ACh-induced P-STS activation by somatostatin. Mean values and standard deviations were calculated from 6 experiments. 1 p = 0.059 when calculated from ranked data by the unpaired two-tailed t-test assuming unequal variances. (D) [Ca2+]i response to 3 mM Trp/6 mM Ca2+ after 10 months and 2 years of continuous cultivation. Mean values and standard deviations were calculated from 6 experiments. 2 p = 0.049 when calculated from ranked data by the unpaired two-tailed t-test assuming unequal variances.
