
Figure 4.
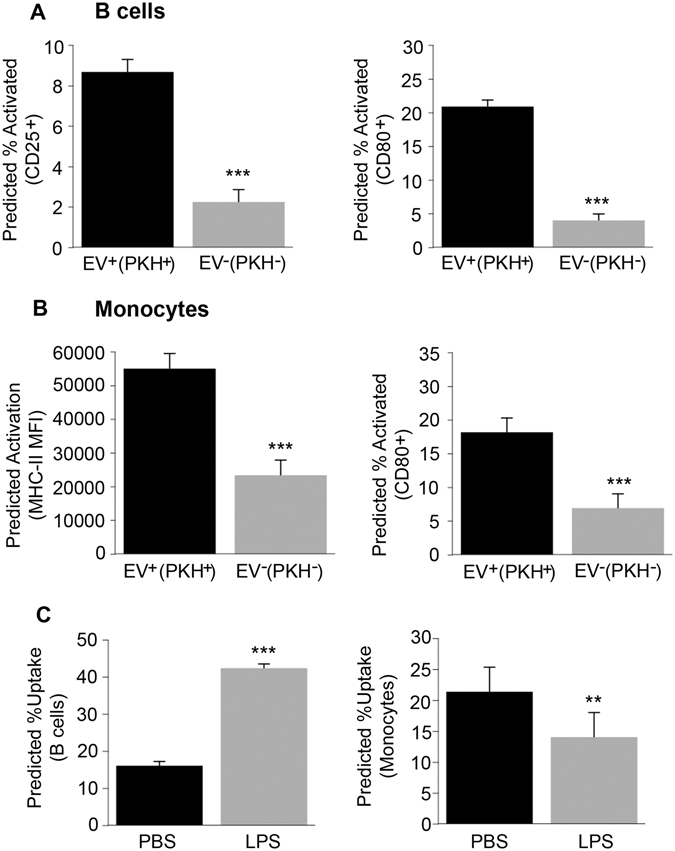
B cell and monocyte activation and EVs. (A) Plasma EVs (n = 54 EV donors) from young, middle-aged and older individuals were incubated with a different PBMC donor for 24 hrs and analyzed by FACS. (B) cells (CD19+) and monocytes (CD11b+CD14+CD15−) were stained with activation markers CD80, CD25 and MHC-II. B cell percentage that express CD25 or CD80 and were positive for EV uptake (CD19+PKH+CD25+ or CD19+PKH+CD80+) were compared to the B cell percentage that express CD25 or CD80 but were not positive for EV uptake (CD19+PKH−CD25+ or CD19+PKH−CD80+). (B) Monocytes that express MHC-II or CD80 and interacted with EVs (CD11b+PKH+MHC-II+ or CD11b+PKH+CD80+) was compared to the monocyte percentage that express MHC-II but did not interact with EVs (CD11b+PKH−MHC-II+ or CD11b+PKH−CD80+). (C) PBMCs from above were treated with LPS or PBS for 2 hrs then EVs (n = 23 a subset of EV donors from A-B) were added for 24 hrs followed by FACS. B cell percentage is shown for (CD19+PKH+) and monocyte percentage for (CD11b+PKH+). The histograms are the value from 54 EV samples for A-B and 23 EV samples for C predicted from linear mixed model regression accounting for matching + 95% confidence interval. ***P < 0.001 and **P < 0.01.