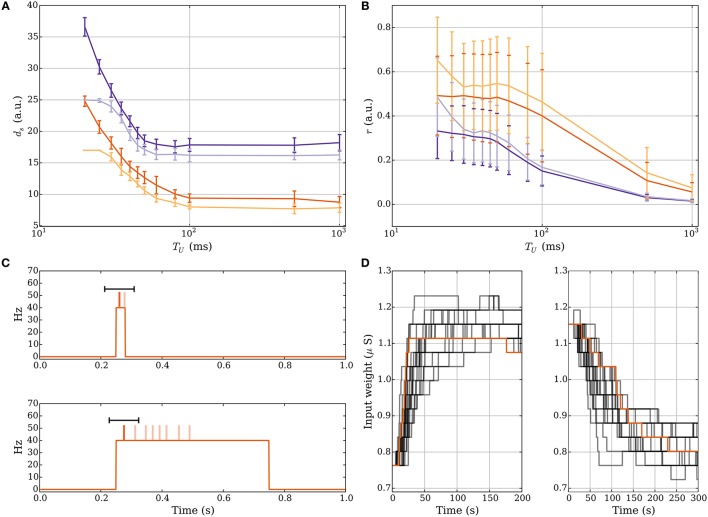
Figure 5.
Comparison of short and long UP phases. (A,B) Dependence of number of strong input synapses ds and relative spike time on the lengths of UP phases. We set TD = 1000.0 ms and we set Tburst = 1000.0 such that there can be only one DSP per UP phase. (A) shows that for long UP phases the mechanism normalizes ds. (B) shows that for short UP phases the mechanism normalizes the relative spike time r within an UP phase. (C) Depression is stronger for sufficiently long UP phases. For two different rate functions the postsynaptic spikes are drawn on top of an UP phase where darker spikes represent DSPs. The black bar represents the learning windows. The time window of the depression signal is completely within the UP phase if the UP phase is long. This increases the expected number of depression signals. To compensate, the input weight needs to decrease in order to correct the ratio of potentiation to depression signals. (D) Weight change for short UP phases of 30 ms with ds = 17 at t = 0 (left panel) and long UP phases of 0.5 s with ds = 27 at t = 0 (right panel). We show 20 example runs with one highlighted in orange for clarity.

