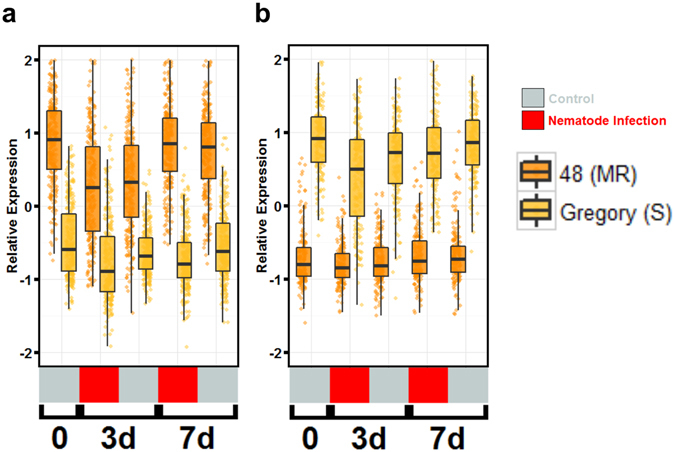
Figure 5.

Differentially expressed genes affected by genotype between RIL 48 (MR) and Gregory (S). (a) Genes constitutively more highly expressed in line 48 compared to Gregory and (b) genes constitutively lower expressed in line 48 compared to Gregory. Boxplots represent median relative expression, first quartile (bottom of box), third quartile (top of box), and maxima. The actual spread of the data is represented by jittered dots so the relative expression of every individual gene is represented on the plot. Uninoculated control (silver) samples and samples inoculated with 20,000 juvenile Meloidogyne arenaria (red) and harvested at 3 days (3d) or 7 days (7d) after inoculation.
