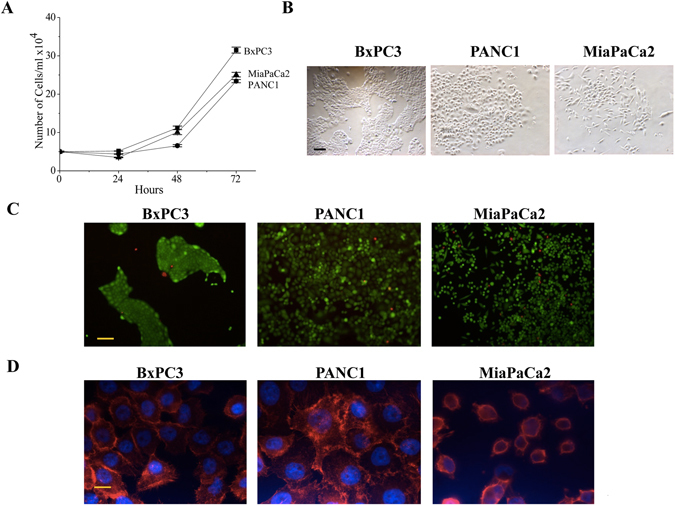
Figure 1.

In vitro cell growth characteristics of PDAC cells in 2D culture conditions. (A) Comparison of growth rate among the PDAC cell lines in terms of increase in number of cells per day (n = 3). Data are means ± SEM of three separate experiments each carried out in triplicate. At the 0.05 level, the PANC1, MiaPaCa2 and BxPC3 are not significantly different. (B) Microscopic images after 48 h of culturing of PDAC cell lines. Morphology was different among the cell lines. (C) Live and dead cells were stained by Calcein (Green) and PI (Red) respectively after 24 h of culturing. (D) Actin filaments were stained by rhodamine conjugated Phalloidin (Red) and nucleus was stained by DAPI (Blue). Scale bars in B and C represent 100 µm, in D represents 10 µm.
