Figure 4.

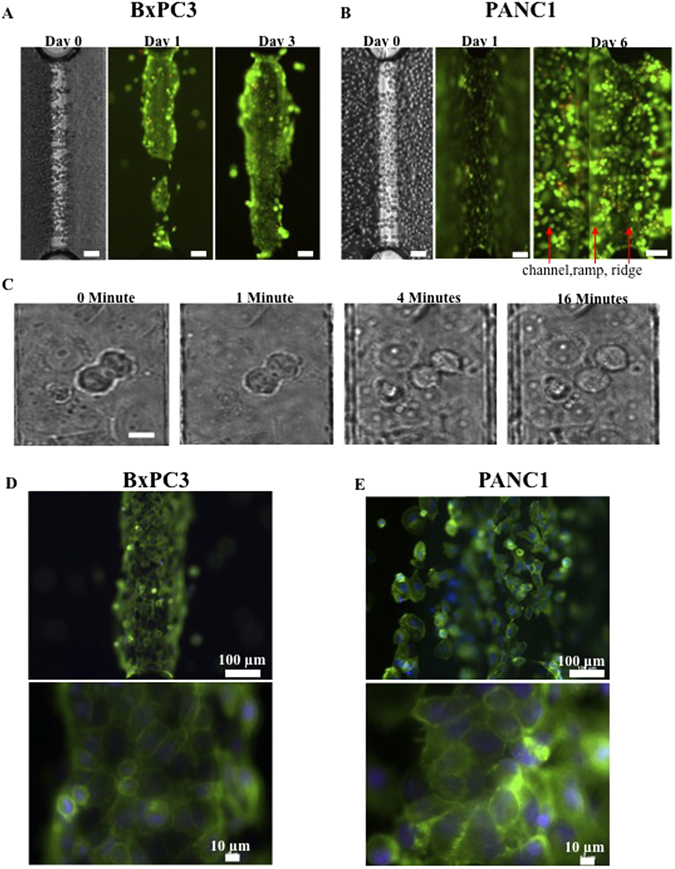
In vitro cell growth characteristics of PDAC cells in the HepaChip®. (A) Live/Dead cell staining of BxPC3: BxPC3 grow selectively on the ridge. (B) Live/Dead cell staining of PANC1: In contrast the PANC1 spread as well channel walls and bottom, so the picture on day 6 was taken in two focal planes: on the channel and on the ridge. (C) Mitosis of BxPC3: Mitosis was observed inside the chip on the collagen coated area after 16 h culture. From left to right pictures taken after 0 min – 1 min – 4 min – 16 min using an inverted microscope. (D) Cytoskeleton assembly of BxPC3 and (E) of PANC1: Fluorescence images after actin and nucleus staining with Phalloidin and DAPI. Scale bars in A and B represent 100 µm, in C represents 10 µm.
