Figure 5.

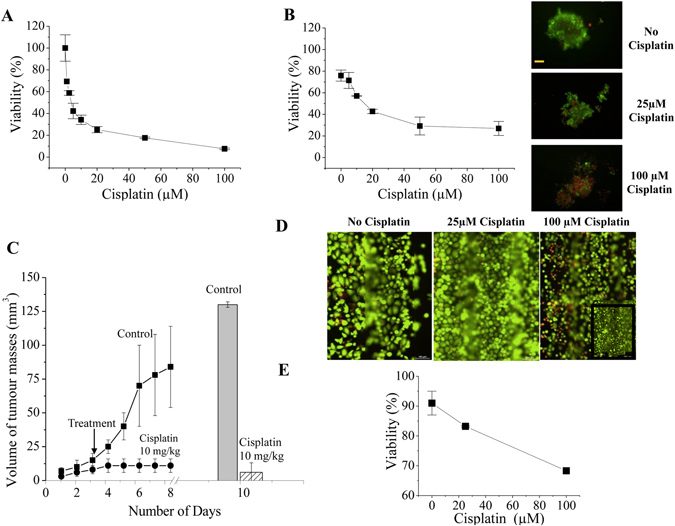
Effect of cisplatin on PANC1 cells. (A) Dose response curve of Cisplatin on PANC1 cells in 2D culture conditions. The calculated IC50 was 3.25 ± 0.2 μM. Data are means ± SD of two separate experiments, each carried out in triplicate. (B) Dose response curve of Cisplatin on PANC1 cells in 3D culture conditions. The calculated IC50 was 14.6 ± 1.6 μM. Data are means ± SD of two separate experiments, each carried out in triplicate. Panels on the right show the live/dead cell staining of the spheroids in control (panel on the top), 25 μM (panel in the middle), and 100 μM (panel at the bottom). (C) Effect of cisplatin on PANC1 cells subcutaneously injected into mice (in vivo). The trend line shows the volume of the masses during the duration of experiment, histogram on the right shows the tumour masses of explant from the animals. (D) Effect of cisplatin on PANC1 cells inside the HepaChip® under continuous perfusion of 3 µL/min. Live/Dead cell staining after 72 h incubation with 0 µM, 25 µM and 100 µM cisplatin; inset: black framed area of the chip cell culture before incubation with 100 µM Cisplatin. Scale bars 100 µm. (E) Effect of different cisplatin concentrations on PANC1 cells cultured inside the HepaChip®.
