
Figure 1.
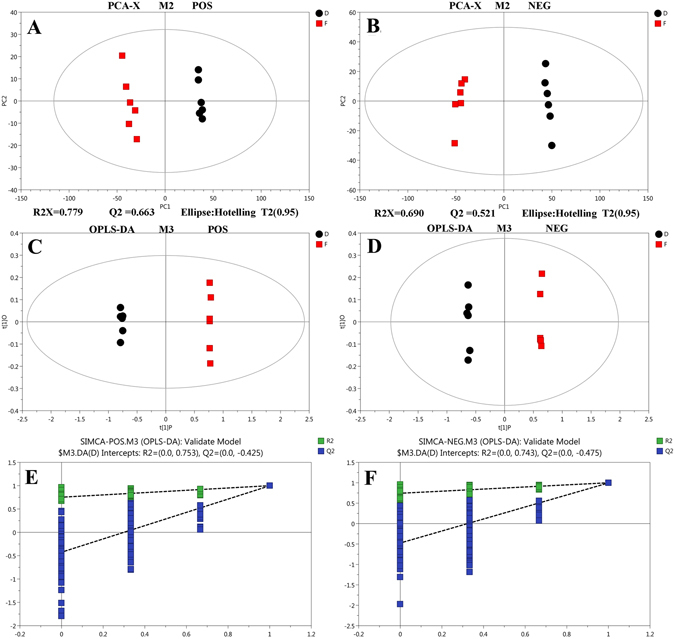
Score plot of the PCA (A,B) and OPLS-DA (C,D) models applied to parasitized and control aphids (POS and NEG). (A,B) Score plot of PCA model obtained from D and F (POS and NEG). (C,D) Score plot of OPLS-DA model obtained from D and F (POS and NEG). a(E,F) Score plot of OPLS-DA model obtained from D and F (POS and NEG). aTwo hundred permutations were performed, and the resulting R2 and Q2 values were plotted. Green square, R2; Blue square, Q2. The green line represents the regression line for R2 and the blue line for Q2.