
Figure 2.
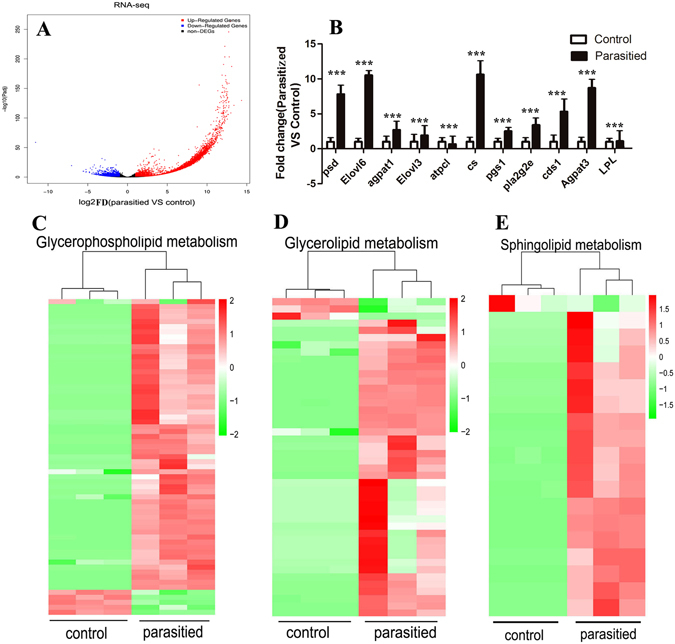
Parasitization Induces Expression of Genes Involved in Lipid Metabolism. Total RNA obtained from both parasitized and non-parasitized control aphids was used for RNA-seq. Differential mRNA expression between parasitized and control samples was determined by false discovery rate (FDR). (A) Log2 fold changes in RefSeq genes in parasitized and control aphids, and the corresponding significance values are displayed as-log10 (FDR). X axis represents −log10 transformed significance. Y axis represents log2 transformed fold change. Red dots represent up-regulated DEGs. Blue dots represent down-regulated DEGs. Black dots indicate non-DEGs. (B) Relative expression levels of up-regulated and down-regulated genes from the RNA-Seq data in the parasitized aphids compared to the control aphids. Data represent the mean of six samples. ***FDR < 0.001, control vs parasitized aphids. (C–E) Heatmap of genes in the glycerophospholipid metabolism (C), glycerolipid metabolism (D) and sphingomyelin metabolism (E) in the parasitized and control aphids. The log10 expression values for each sample were clustered. Scale bars on the top right of each heatmap represent the degree of gene expression with red showing high expression and green indicating low expression.