
Figure 4.
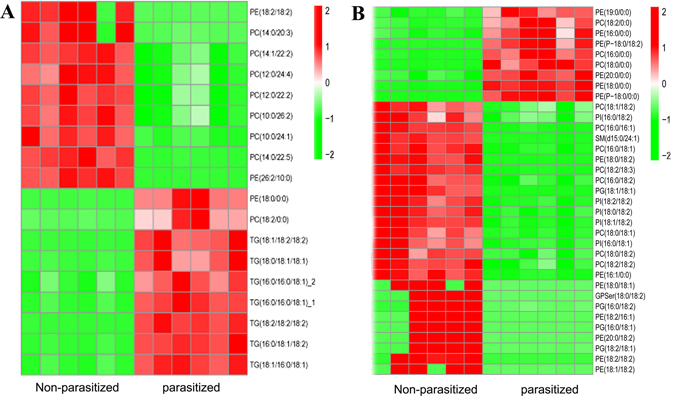
Heatmaps of the integration of intermatrix Lipids correlation between D vs F (A- POS, B - NEG). Heat maps were applied to display the quantitative expression of lipids with a red color gradient representing high expression and a green color gradient representing low expression. Lipid synthesis metabolites with significant changes in the non-parasitized aphids and parasitized aphids groups from UHPLC-Q-TOF-MS was analyzed in the heatmap (VIP > 1, p value < 0.05). Scale bars on the top right of each heatmap represent the degree of gene expression with red showing high expression and green indicating low expression.