
Figure 6.
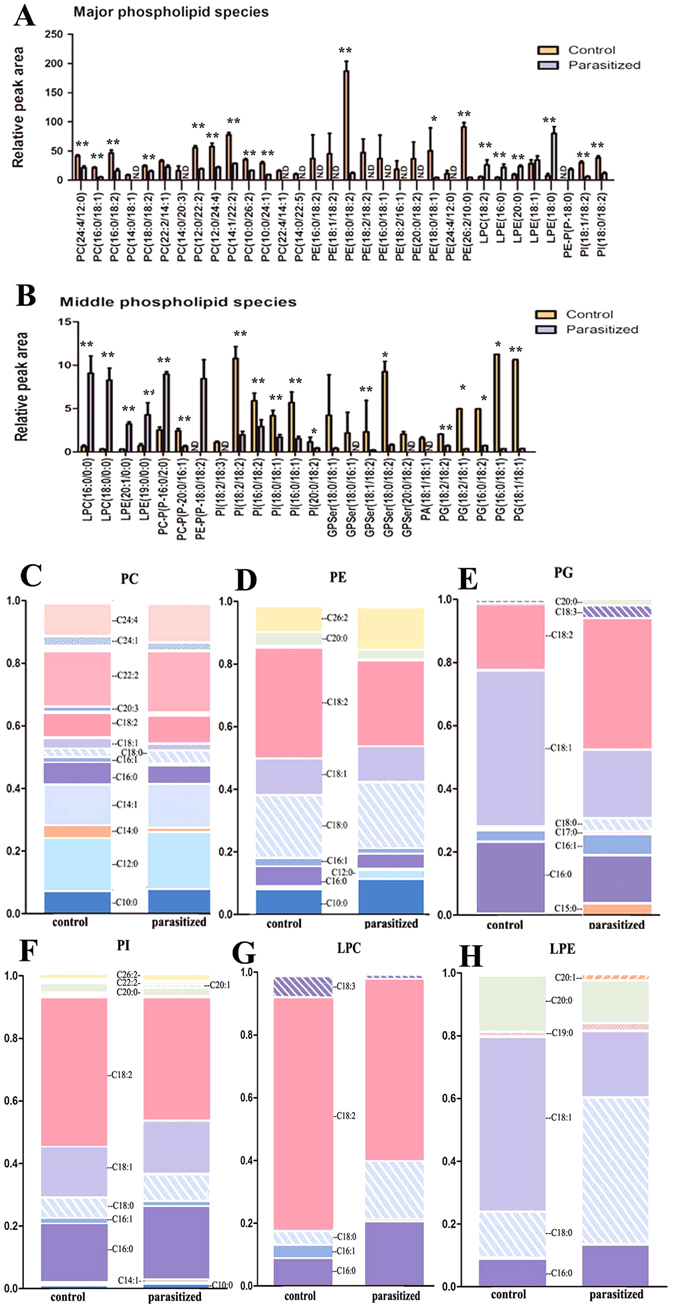
Changes in the lipid composition and fatty acyl chains of phospholipids in parasitized aphids. (A,B) Quantification of the relative peak area of major phospholipids (A) and middle phospholipids (B) in parasitized and control aphids. Data are means ± SEM; n = 6/group. *p < 0.05, **p < 0.01. N.D, not detected. (C–H) Changes in the glycerophospholipid base chemistry and fatty acyl chains in the phospholipids of parasitized and control aphids (PC, C; PE, D; PG, E; PI, F; LPC, G; LPE, H). Data are means ± SEM (n = 6/group).