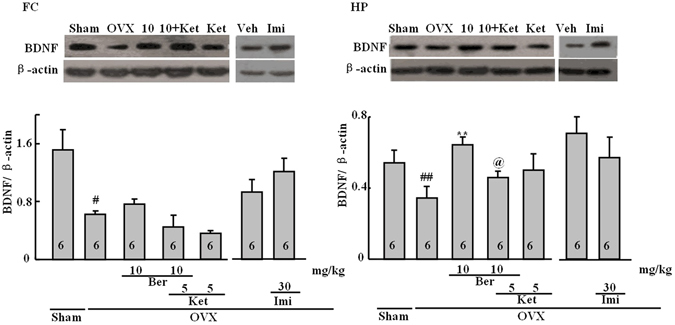
Figure 5.

Representative western blots for BDNF and β-actin. The frontal cortex (FC; left) and the hippocampus (HP; right). Figures represent the BDNF levels (normalized to β-actin) in the FC and HP. Group conditions are indicated by abbreviations and doses by numbers: sham (sham treatment), OVX (ovariectomy), Ber (berberine, 5 or 10 mg/kg), Ket (ketanserin, 5 mg/kg) and Imi (imipramine, 30 mg/kg). Symbols represent significant post hoc comparisons: Tukey’s HSD, # P < 0.05 vs. sham, **P < 0.05 versus OVX only.
