
Figure 1.
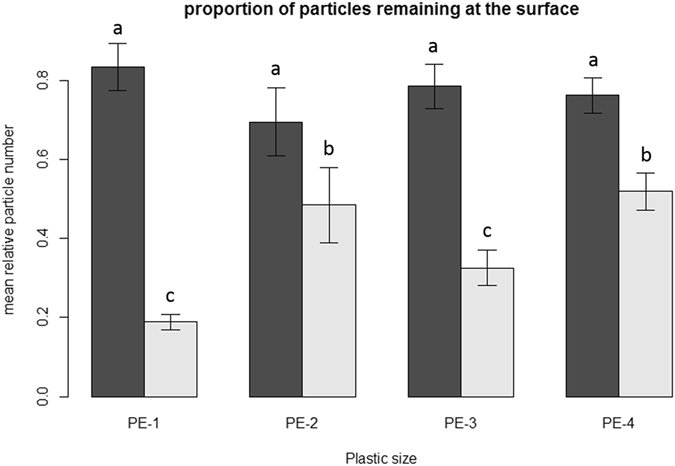
Mean relative microplastic particle numbers recovered from the soil surface after the experiment (expressed as a percentage of the number of particles added to the soil surface at the beginning), error bars indicate standard error. Dark grey bars show values in absence of earthworms, while light grey bars give data with earthworms. Results are shown for four different particle size ranges: 710–850 μm (PE-1), 1180–1400 μm (PE-2), 1700–2000 μm (PE-3) and 2360–2800 μm (PE-4). Different letters above bars indicate significant differences (P < 0.05; Tukey-Kramer HSD).