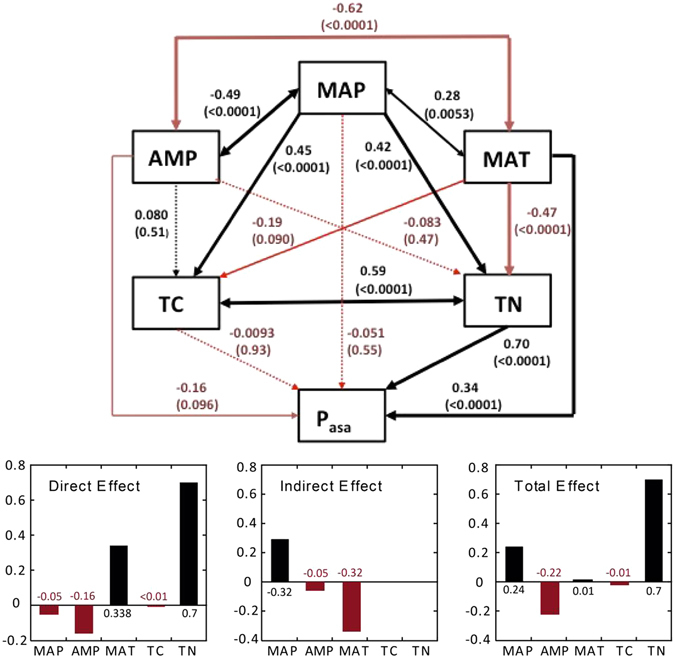
Figure 3.

Structural equation modeling. The total effects of Total Nitrogen (TN) and Mean Annual Precipitation (MAP) were positive over phosphatase (Pasa). The effect of thermal amplitude (AMP) was negative, and Mean Annual Temperature (MAT) did not contribute significantly due to the opposite signals of its direct and indirect effects. Black arrows and bars represent positive effects, and red arrows and bars represent negative interactions. The width of the arrows is proportional to the amount of the variance explained and P-values are in brackets. R 2 for endogenous variables are TC = 0.18, Acid phosphatase = 0.5, TN = 0.28.
