
Figure 4.
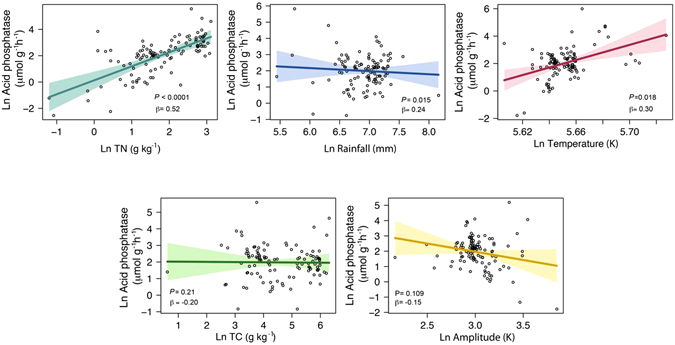
Partial residual plot. Partial residual plot of the variability of global Ln phosphatase activity (µmol g−1 h−1) explained by Ln TN (g kg−1), Ln MAP (mm), Ln MAT (K), Ln TC (g kg−1) and Ln AMP (K) (visreg R package82). Partial residual plots permit the evaluation of the effect of each variable on a full model without interactions. The linear model included TN, MAP, MAT, TC and AMP. Colorful areas indicate confidence band (0.95). All variables were Ln-transformed. See Supplementary Table 1 (Model 3) in the Supplementary Information for a summary of the linear model.