
Figure 5.
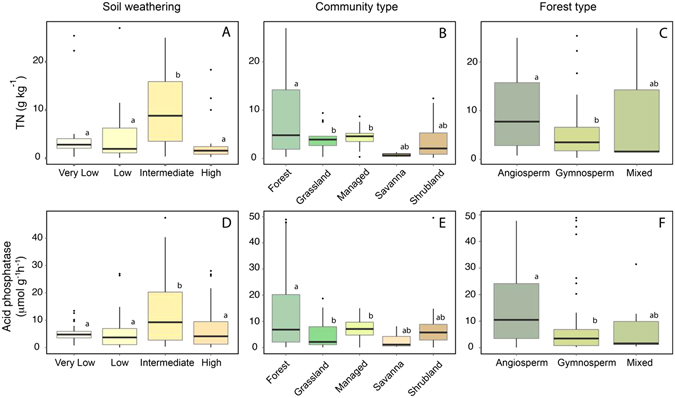
Acid phosphatase activity on different Soil weathering, Community and Forest types. Dependence of TN (A) and phosphatase activity (D) on the amount of soil weathering. Only sites with information for soil type were included (n = 204). Dependence of TN (B) and phosphatase activity (E) on community type (n = 291). Dependence of TN (C) and phosphatase activity (F) on forest class. Only sites with an accurate description of the vegetation were included (n = 171). Boxplot show median values (solid horizontal line), 50th percentile values (box outline), 90th percentile values (whiskers), and outlier values. Letters represent the results of Tukey’s post-hoc comparisons of group means.