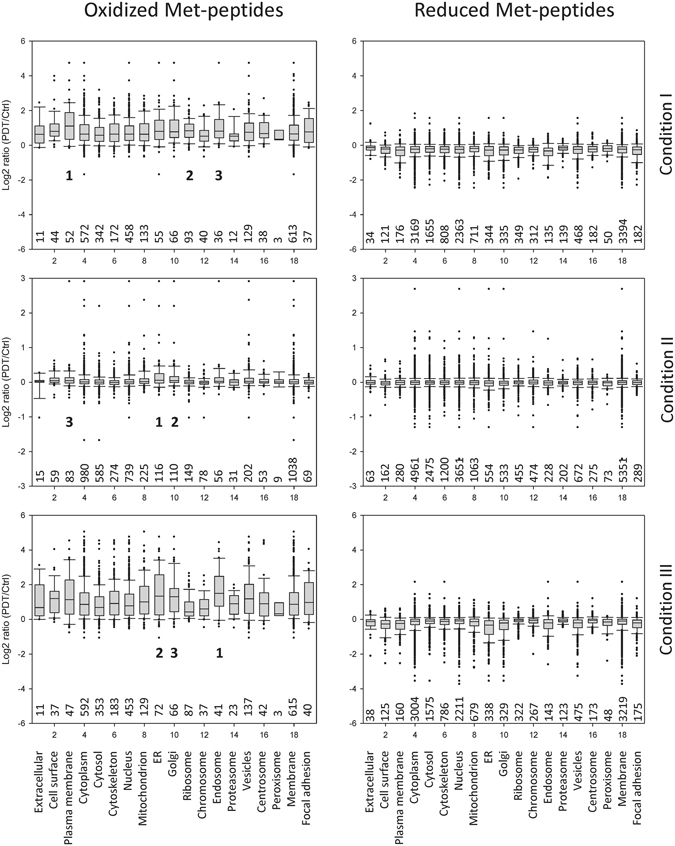
Figure 5.

The redox status of cellular organelles in A431 cells subjected to the different Photofrin-PDT regimens. The proteins corresponding to the quantified Met-peptides (oxidized or reduced) were assigned to their known subcellular locations using GO analysis, and the log2 (PDT/Ctrl) ratio distributions of all oxidized (left panels) and reduced (right panels) Met-peptides were analyzed for each cellular site/organelle under each PDT condition. The box representations are the same as in Fig. 4. The numbers of oxidized (or reduced) Met-peptides grouped and analyzed in each cellular site/organelle are shown below each box. The top three most severely oxidized cellular structures in each PDT condition are indicated by 1, 2 and 3 in left panels.
