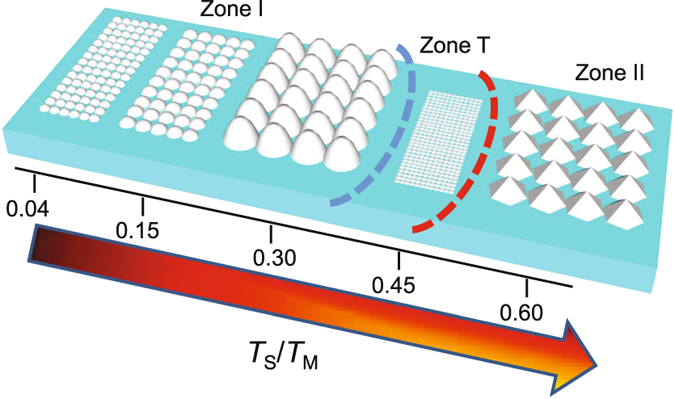
Figure 2.

Schematic representation of a zone structure diagram for Al sputtered at constant pressure and power but different substrate temperatures showing the evolution of the grain structure with substrate temperature to melting temperature (T S/T M) ratios. In Zone I, the grains are porous and become larger as T S/T M increases. The transition zone (T) has densely packed and smaller grains and in Zone II the film crystallizes and have large columnar grains.
