
Figure 5.
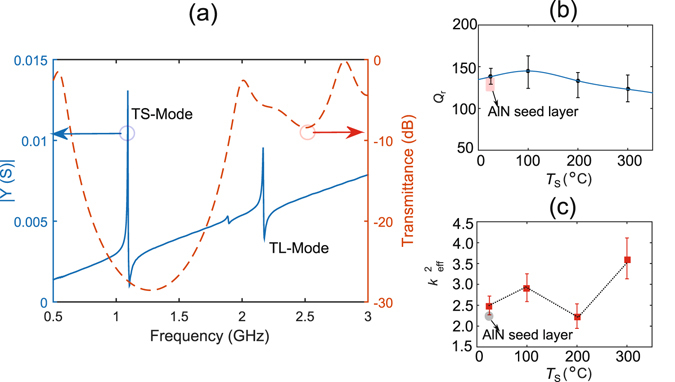
(a) Electrical admittance spectrum of a typical device showing a thickness shear mode resonance at 1.1 GHz and a thickness longitudinal mode resonance at 2.2 GHz. Dashed red line shows the modelled shear mode transmittance spectrum of the fabricated acoustic reflector. (b) Displays the average shear mode Q r of devices measured at each Al deposition temperature; T S; the highest Q r is achieved at 100 °C. (c) Shows the of devices, which follow a similar trend as Q r except at 300 °C where a mean shear mode of 3.6% is achieved. Shaded areas in (b,c) show the performance of devices from our previous work using AlN seed layer to grow inclined c-axis ZnO16.