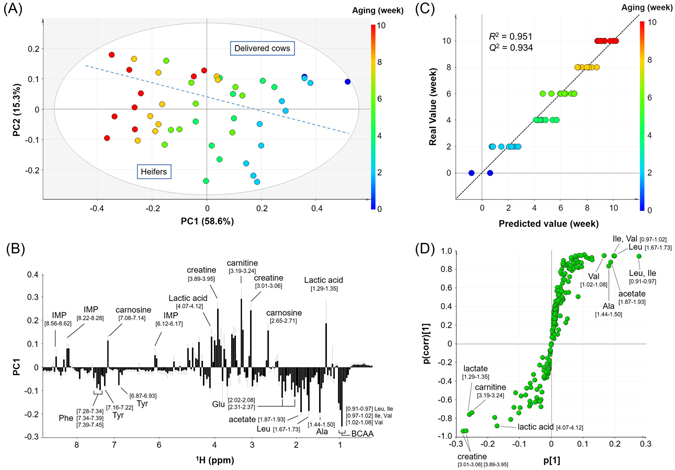
Figure 4.

Multivariate data analysis of the 1H NMR spectra of the D2O extracts of ribeye samples with different aging duration. Ribeye samples are derived from heifers and delivered cows. (A) PCA score plot of PC1 versus PC2. The plots are color-coded according to aging duration (week): 0, blue; 2, cyan; 4, turquoise; 6, light green; 8, yellow; and 10, red. The heifer samples are positioned separately from the delivered cow on the score plot, and the individual regions are divided by a dashed line. (B) Loading plot for PC1 of the score plot shown in panel A. Buckets with high loading values are labeled by the assigned compound names. The square brackets represent the chemical shift range of each spectral bucket. (C) OPLS regression model for the prediction of aging duration. Predicted values are derived from the OPLS model of the 1H NMR spectra. The plots are color-coded according to aging duration (week): 0, blue; 2, cyan; 4, turquoise; 6, light green; 8, yellow; and 10, red. (D) S plot for the OPLS regression model shown in panel C. Buckets with high absolute values of p[1] and p(corr)[1] are labeled with the assigned compound names. The square brackets represent the chemical shift range of each spectral bucket.
