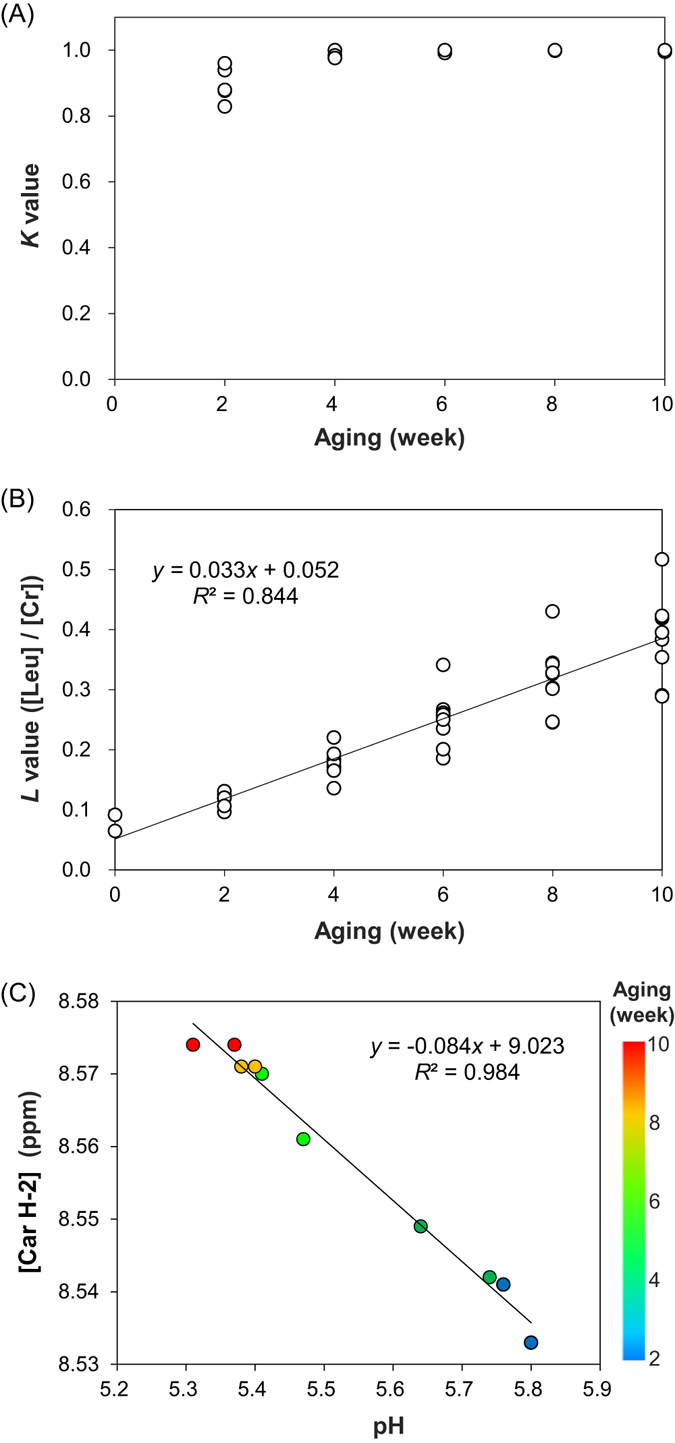
Figure 6.

Indicators of aging progression. Correlation of aging duration with (A) K value and (B) L value, represented by the ratio of leucine ([Leu]) to creatine ([Cr]). (C) Correlation between pH and [Car H-2], represented by the chemical shift of the 1H signal at C-2 of the imidazole ring of carnosine (Car). The [Car H-2] value in the observed pH range shows a linear correlation with pH, although overall pH profile of [Car H-2] is sigmoidal42. The plots are color-coded according to aging duration (week): 2, blue; 4, green; 6, light green; 8, yellow; and 10, red.
