
Figure 1.
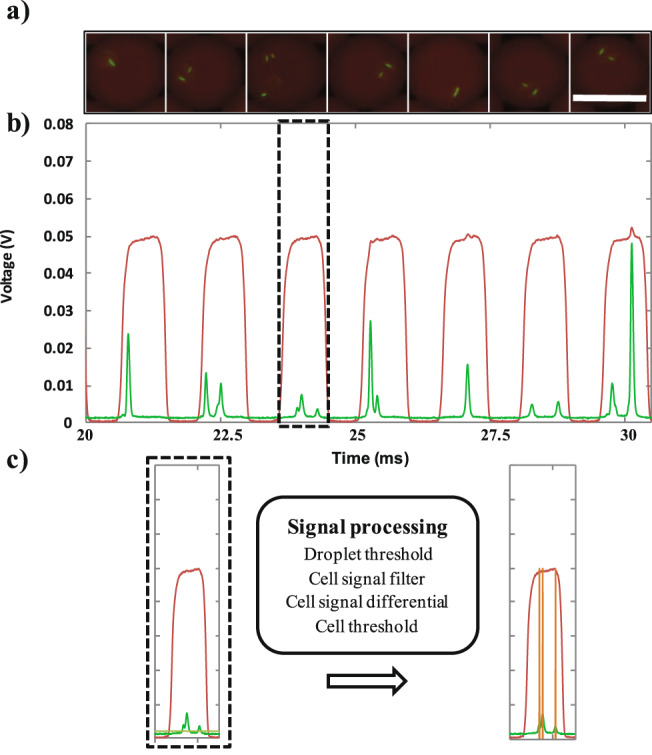
Schematic representation of the cell counting procedure. eGFP-transformed E. coli cells were encapsulated in droplets. (a) Fluorescent images of red coded droplets encapsulating E. coli cells at λ = 2 (mean cell per droplet ratio). Scale bar: 30 µm. Corresponding time sequence of red and green fluorescence signals is shown in (b). Dashed black rectangle encloses a signal sample corresponding to a droplet chosen as an example to illustrate the signal processing analysis. (c) The signal processing method is schematized in the black box. Briefly, each droplet is identified by applying a droplet threshold on the red fluorescence channel. The green fluorescence channel was then filtered within each droplet, and a first order differential is applied to identify the local maximal values. A cell threshold (grey line) is eventually applied to identify cells. The number of cells per droplet is then enumerated as signal peaks (orange) within the interval of each droplet. An exhaustive description of the process can be found in Supplementary Fig. S1.