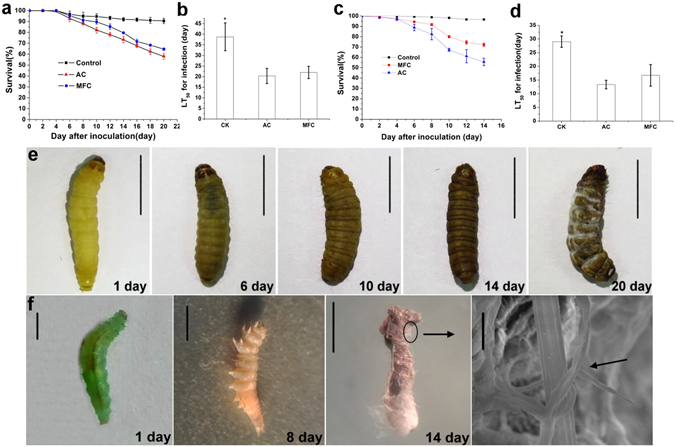
Figure 6.

Insect bioassays. (a) Bar graph quantifying of survival rate of Galleria mellonella after application of AC and MFC of Hirsutella satumaensis. Relative mortality (relative to the mortality of control group, 9.43%) following application of AC (32.6% ± 1.95%) was significantly different (p < 0.05) than that upon infection with MFC (25.9% ± 1.50%). (b) LT50 for inoculation assay of G. mellonella. Compare with MFC, LT50 of AC is shorter though with no significant difference between them. (c) Bar graph quantifying of survival rate of Pyrausta xylostella after application of AC and MFC. P. xylostella was more sensitive to H. satumaensis, the lethality reaching 45.11% ± 3.528% (AC) and 27.45% ± 5.507% (MFC) respectively comparing with the control group (the mortality with 3.33%) after 14 days of inoculation. (d) LT50 for inoculation assay of P. xylostella. The LT50 between AC and MFC show more difference though not reaching a significant level at 0.05. (e) Shows cuticles change of G. mellonella after treatment 1 day, 6 day, 10 day, 14 day and 20 day. The cuticles of G. mellonella larvae change from gray to brown after infection and hyphae and conidia producing on cadaver surface at last. Bar = 1 cm. (f) Shows cuticles change of P. xylostella after treatment 1 day, 8 day and 14 day. The last one is the insect covering with hyphae and conidiogenous cell of H. satumaensis under SEM. The bar of insects = 2 mm; bar of SEM = 10 μm. Statistical analysis was performed using a one-way ANOVA. Error bars are standard deviations of three trials and panels are representative of at least 2 independent experiments, *p < 0.05.
