
Fig. 1.
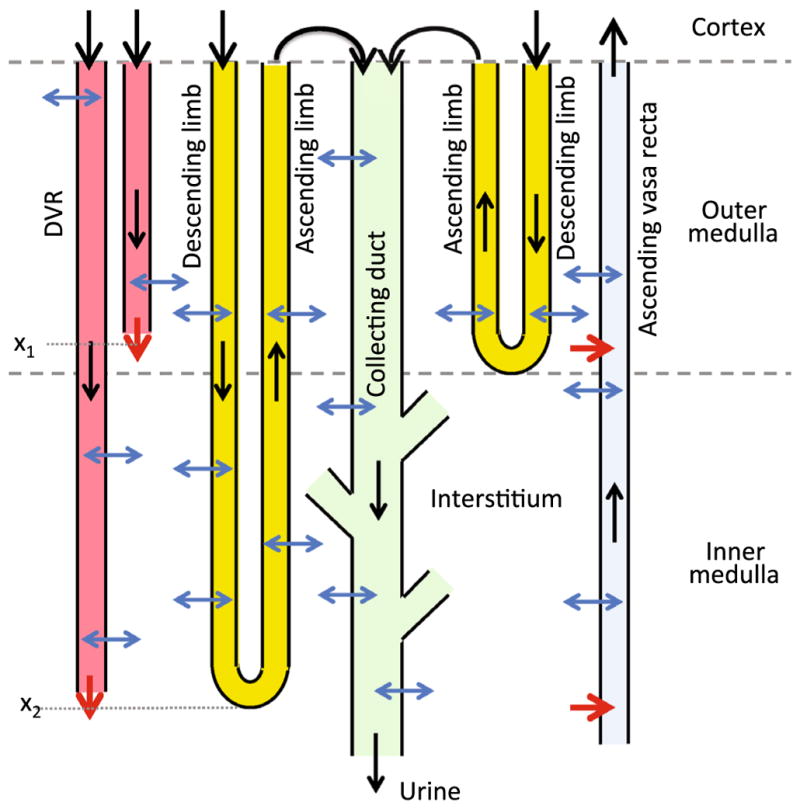
Schematic diagram of model structure. A short loop, which consists of a descending limb and a contiguous ascending limb and which turns at the outer–inner medullary boundary, is represented. The diagram also depicts a long loop that turns within the inner medulla (at x2) (Layton 2011a). Although only one long loop is shown, the model represents one long loop that turns at every spatial point in the inner medulla. Similarly, only two representative DVR are shown (with one terminating at x1 and one at x2), whereas the model represents one DVR that terminates at every spatial point. A representative collecting duct is shown; the “branches” represent the coalescence of the collecting ducts in the inner medulla (Layton 2011a). The black arrows at the cortico-medullary boundary represent boundary flows. The outflow of the ascending limbs determines the inflow of the collecting duct. The red arrows at the DVR outlets denote capillary sources at x1 and x2. The net fluid and solute accumulations at those medullary levels are taken up by the ascending vasa recta, as indicated by the red arrows pointing into the ascending vasa recta. The blue arrows represent transmural water and solute fluxes. Collecting duct outflow becomes urine (Color figure online)