Figure 1.

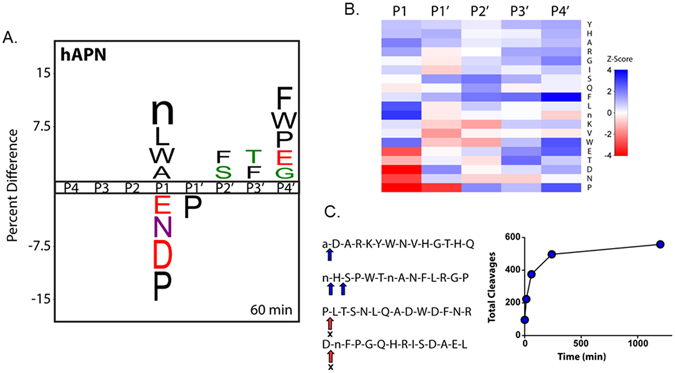
Global identification of human aminopeptidase N (hAPN) substrate specificity with the MSP-MS assay. (A) IceLogo representation of P1–P4′ specificity at the 60 min assay time point (P ≤ 0.05 for all residues shown; “n” is norleucine). Residues with a positive percent difference are considered favorable at a given position; residues with a negative percent difference are considered disfavorable. (B) Heat map representation of hAPN P1–P4′ specificity at the 60 min assay time point calculated using Z-scores at each position. Favored residues are colored blue (Z-score > 0) and disfavored residues are colored red (Z-score < 0). iceLogo representations and heat maps for the 15, 240, and 1200 min assay time points are provided (Supplementary Figure 1). (C) Example 14-mer peptides from the MSP-MS library are shown with primary and secondary cleavages indicated with a blue arrow. “X” indicates that no cleavage was detected at the indicated position. A progress curve is provided depicting the total cleavages observed at each assay time point.
