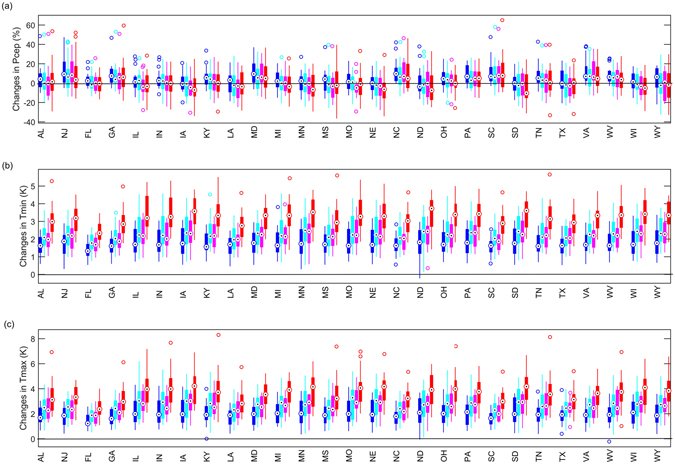
Figure 3.

Projected changes in (a) precipitation (Prec), (b) daily minimum temperature (Tmin), and (c) daily minimum temperature (Tmax) by 2050 s relative to 1970–1999. 97 bias-corrected climate projections under four RCPs are used to characterize the uncertainty from climate models and emission scenarios. Only states where the constructed empirical models are significant at the 95% confidence level are included for analysis. Figure was created using software MATLAB 2015a (http://www.mathworks.com/).
