
Figure 7.
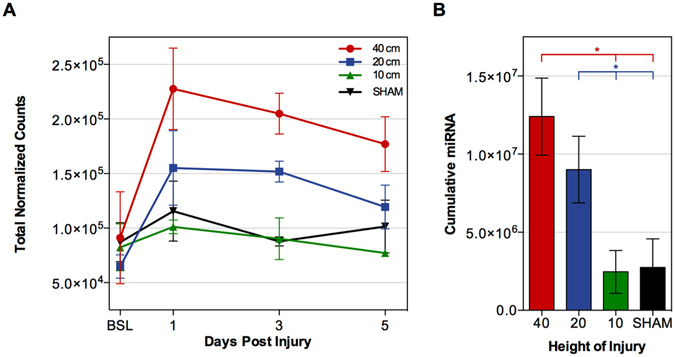
Effect of Injury Severity on total Systemic miRNA. (A) The total number of normalized miRNA counts in the 40 cm (red), 20 cm (blue), 10 cm (green), and SHAM (black) groups. Data points represent the average of the normalized total miRNA reads for n = 4 animals per group and time point (see Table 1). (B) The cumulative miRNA expression over time in the 40 cm (red), 20 cm (blue), 10 cm (green), and SHAM (black) groups. Asterisks indicate significant differences determined by ANOVA. Data is presented as means ± SEM.