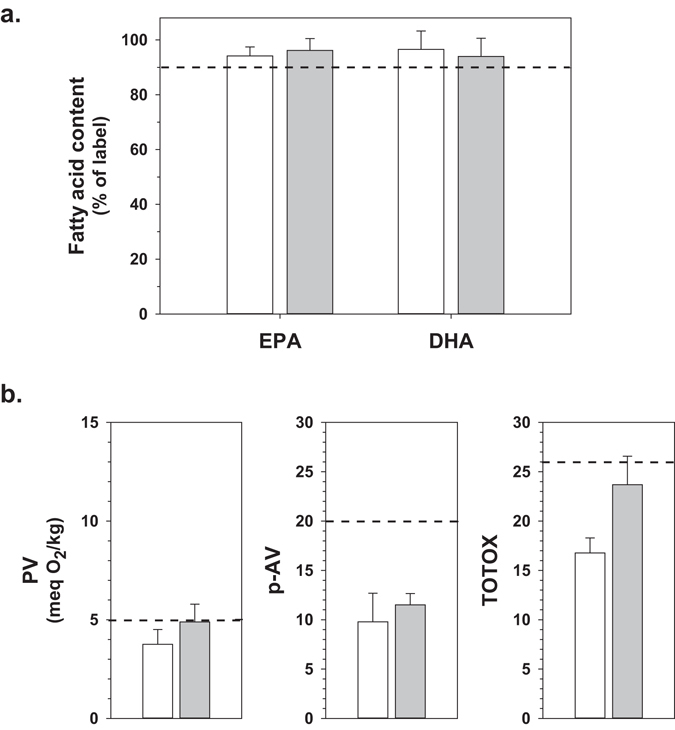
Figure 3.

Content of EPA/DHA and oxidative status of several New Zealand fish oil products that were within one year before expiry date (white bars), and after retesting a year later after having passed expiry date (grey bars). Panel a: EPA and DHA content expressed as percentage of labeled content (means ± S.D., n = 5 products). The dashed line indicates the minimum required content of EPA and DHA according to local regulations. Panel b: PV (left), p-AV (middle) and TOTOX (right). Values are means ± S.D., n = 5 products for PV, and n = 3 for p-AV and TOTOX as two products were flavored and could not be tested for p-AV and TOTOX). The dashed lines indicate the maximum levels of PV, p-AV and TOTOX as specified by GOED.
