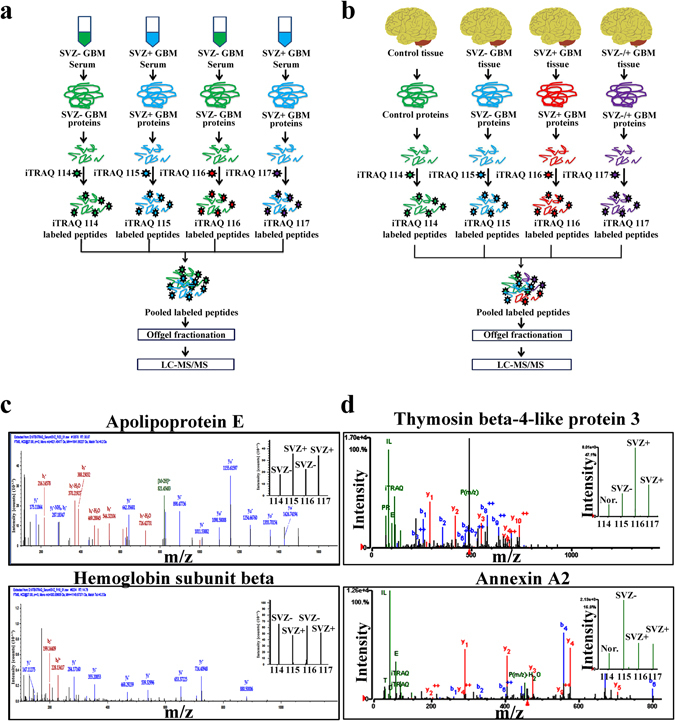
Figure 2.

Quantitative serum and tissue proteomic analysis of SVZ+ and SVZ- GBMs. Schematic of iTRAQ based proteomic analysis of (a) serum and (b) tissue specimens for the identification of quantitative proteomic alterations. (c) Serum proteomic analysis of SVZ+ (n = 12) and SVZ- (n = 12) GBMs was performed using iTRAQ method. Representative mass spectra for one of the highly up-regulated (apolipoprotein E) and down-regulated (hemoglobin subunit beta) proteins in SVZ+ GBMs (w.r.t SVZ− GBMs). (d) Tissue proteomic analysis of SVZ+ (n = 6) and SVZ- (n = 6) GBMs was performed using iTRAQ approach. Representative mass spectra of two differentially expressed proteins, thymosin beta-4-like protein 3 and annexin A2 in SVZ+ GBM tumors (w.r.t SVZ− GBMs). Relative abundance of thymosin beta-4-like protein 3 and annexin A2 protein are shown in the inset as the intensities of iTRAQ reporter ions.
