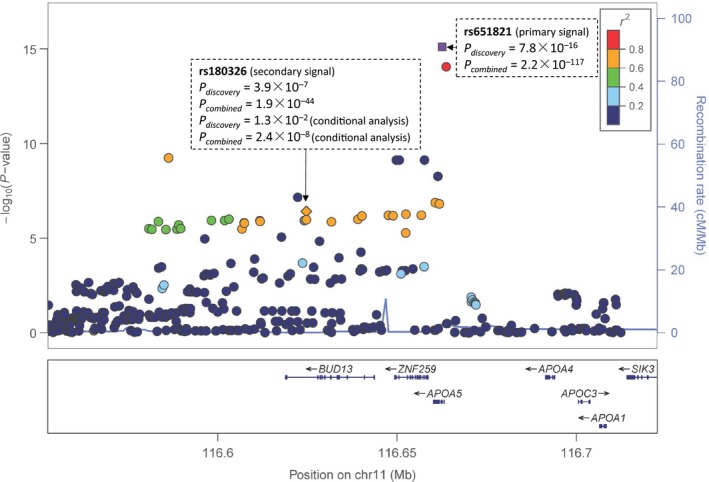
Figure 2.

The regional plots of the top signal at rs651821 and the secondary signal at rs180326 for triglyceride. The regional plots were plotted via the online tool LocusZoom using ASN population as reference for LD calculations in hg19 coordinates. P‐values used for the regional plot were estimated from the discovery stage. The combined P‐values were given for the two signals. For rs180326, the conditional analysis was performed adjusting the top signal at rs651821.
