Figure 5.
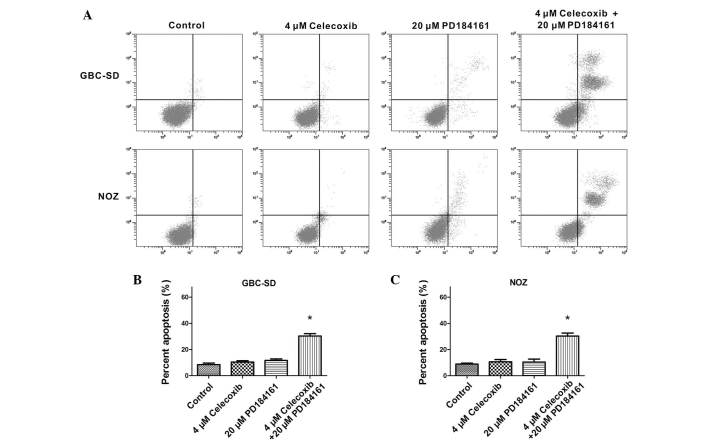
Combination of celecoxib and PD184161 induced apoptosis in gallbladder carcinoma cells. (A) Representative flow cytometry results from three independent experiments are shown. Lower left quadrants represent the Annexin–/PI– viable cells, lower right quadrants represent the Annexin+/PI– early apoptotic cells, and the right upper quadrants represent Annexin+/PI+ late apoptotic cells. In (B) GBC-SD and (C) NOZ cells, the apoptotic cell population did not increase following treatment with 4 µM celecoxib or 20 µM PD184161 alone; however, it was elevated following treatment with a combination of 4 µM celecoxib and 20 µM PD184161. Data are presented as the mean ± standard deviation. *P<0.05 vs. other groups. PI, propidium iodide.

