
Figure 1.
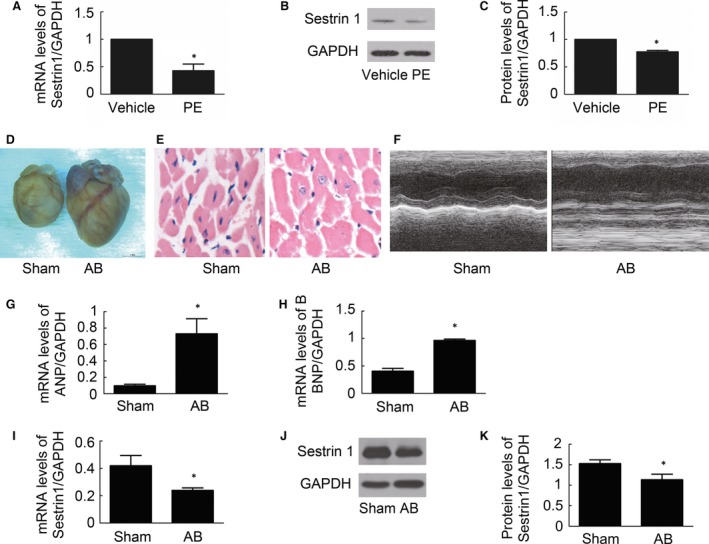
Effect of PE on Sestrin 1 expression in cardiomyocytes. (A) The relative mRNA levels of Sestrin 1 mRNA expression 24 hrs after vehicle or PE treatments. (B) Representative immunoblots of Sestrin 1 and GAPDH in cardiomyocytes 24 hrs after vehicle or PE treatments. (C) Quantitative analysis of data shown in (B). (D, E) Representative image of the heart and cardiac sections with HE staining from mice 4 weeks after aortic banding or sham surgery. (F) M‐mode echocardiography after aortic banding or sham surgery. (G, H) The relative mRNA levels of ANP and BNP 4 weeks after aortic banding or sham surgery. (I) The relative mRNA levels of Sestrin 1 after aortic banding or sham surgery. (J) Representative immunoblots of Sestrin 1 and GAPDH levels in the heart after aortic banding or sham surgery. (K) Quantitative analysis of data shown in (J). GADPH was used as an internal control. *P < 0.05 versus the corresponding vehicle group. The blots represent three independent experiments, n = 3–5.