Figure 6.

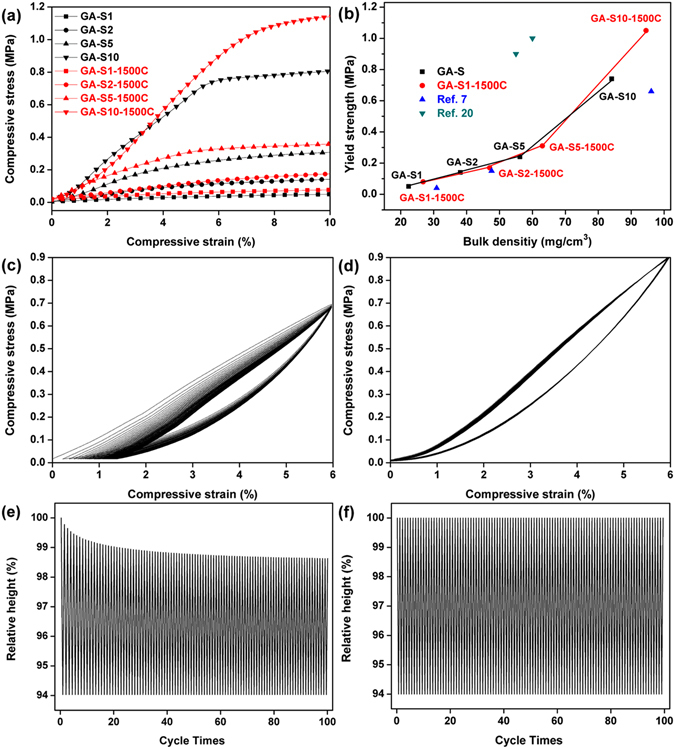
(a) Typical compressive stress–strain curves for GA-S (black) and GA-S-1500C (red) in the strain range of 0–10%. (b) The comparison of yield strength/density between GA-S, GA-S-1500C and other mechanically strong graphene aerogels. Stress–strain curves of (c) GA-S10 and (d) GA-S10-1500C upon repeated compression to 6% strain for 100 cycles. Relative heights of graphene aerogel cylinders in cyclic compression process for (e) GA-S10 and (f) GA-S10-1500C.
