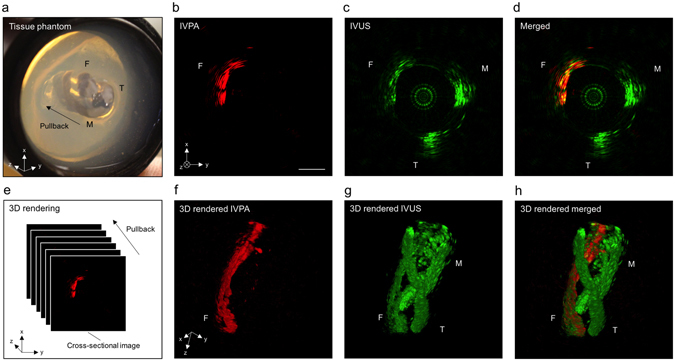
Figure 6.

IVPA-US imaging of tissue phantom at 16 fps. (a) Picture of tissue phantom. F, intramuscular fat; T, tendon; M, muscle. Cross-sectional (b) IVPA, (c) IVUS, and (d) merged images of the tissue phantom. The scale bar and the coordinates in (b) is also applied to (c,d). (e) 3-D rendering method. 3-D rendered (f) IVPA, (g) IVUS, and (h) merged images of the tissue phantom with a pullback length of 10 mm. The coordinates in (f) is also applied to (g,h). Scale bar: 1 mm.
