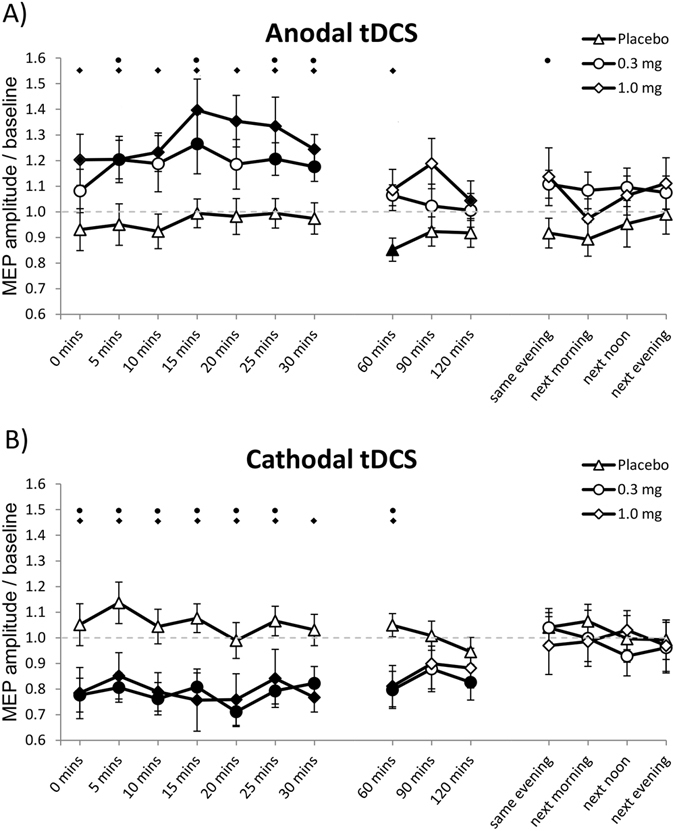
Figure 2.

Impact of varenicline on tDCS-induced neuroplasticity. Shown are baseline-normalized MEP amplitudes after plasticity induction by anodal (A) and cathodal (B) tDCS under 0.3 mg, 1.0 mg varenicline or placebo medication conditions up to the evening of the post-stimulation day. (A) In smokers under placebo medication, anodal tDCS induced no excitability enhancement, while 0.3 mg and 1.0 mg varenicline resulted in enhanced MEP amplitudes after anodal tDCS. (B) In the placebo condition, cathodal tDCS failed to induce excitability alterations. In contrast, both low and high doses of varenicline led to significant inhibitory after-effects of tDCS. Error bars indicate S.E.M. Filled symbols indicate significant differences of post-stimulation MEP amplitudes from respective baseline values; Floating symbols indicate significant differences between the respective drug and placebo medication conditions at the same time points (Student’s t-test, two tailed, paired samples, p < 0.05).
